Excellent 4.6 out of 5
Metabolic and Nutritional Disorders

Diabetes Mellitus Type 2

Biomarker testing clarifies how your body regulates sugar and insulin, revealing early metabolic stress and disease progression. At Superpower, we measure Glucose, HbA1c, eAG, and the TyG Index for Diabetes Mellitus Type 2 to assess glycemia, average exposure, insulin resistance proxies, and cardiometabolic risk.

With Superpower, you have access to a comprehensive range of biomarker tests.

Test for Diabetes Mellitus Type 2
Cancel anytime
HSA/FSA eligible
Results in a week
Physician reviewed

Every result is checked

·
CLIA-certified labs

Federal standard for testing

·
HIPAA compliant

Your data is 100% secure

Key Benefits

  • See your current and long-term blood sugar control for Type 2 diabetes.
  • Spot early sugar imbalance before symptoms; fasting glucose and HbA1c flag prediabetes or diabetes.
  • Clarify fatigue, thirst, or frequent urination by confirming sustained high glucose.
  • Guide treatment choices and goals using HbA1c and eAG toward personalized targets.
  • Track progress or relapse; HbA1c reflects 2–3 months, eAG translates averages.
  • Flag insulin resistance and fatty liver risk using the TyG Index.
  • Protect heart, kidneys, eyes by keeping glucose and HbA1c in-range.
  • Best interpreted with lipids, blood pressure, weight, and your symptoms.

What are Diabetes Mellitus Type 2

Biomarkers for type 2 diabetes are measurable signals that reveal how well your body manages sugar and how chronic sugar exposure affects organs. They enable early detection, show what’s driving the condition, and guide personalized treatment. Core markers track glucose control across time: long‑term average sugar (HbA1c, glycated hemoglobin), day‑to‑day levels (fasting glucose), and after‑meal surges (postprandial glucose). Others describe the insulin system—how much insulin you produce (C‑peptide), how hard the pancreas is working (insulin), and how responsive tissues are to insulin (insulin resistance). Downstream markers reflect collateral strain and cardiometabolic risk: blood lipids (triglycerides, HDL, ApoB), liver stress from fat buildup (liver enzymes), low‑grade inflammation (C‑reactive protein), and early kidney leakage (urine albumin). Following these markers over time shows whether lifestyle and medications are improving sugar handling and protecting organs. In short, type 2 diabetes biomarkers translate a complex metabolic disorder into clear, trackable signals that support diagnosis, risk assessment, and ongoing care.

Why are Diabetes Mellitus Type 2 biomarkers important?

Diabetes Mellitus Type 2 biomarkers are the body’s dashboard for sugar and insulin biology. They show how well you convert food into usable energy, how hard your pancreas and liver are working, and how much chemical “sugar stress” your blood vessels, nerves, kidneys, and eyes endure over time.

Fasting glucose typically sits around 70–99; values creeping to 100–125 signal impaired fasting regulation, and 126 or higher suggests diabetes. HbA1c under 5.7 is considered normal, 5.7–6.4 reflects increased risk, and 6.5 or higher indicates diabetes; eAG mirrors this, roughly near 100 when HbA1c is about 5.0, around 117 at 5.7, near 140 at 6.5, and mid‑150s around 7.0. For these markers, healthier status tends to live in the low-to-mid range, because lower chronic glucose exposure reduces glycation damage. The TyG Index, derived from fasting triglycerides and glucose, rises with insulin resistance; lower values generally indicate more favorable metabolism and less fatty liver and cardiovascular strain.

When values drop too low, especially glucose, the brain and muscles are under-fueled: shakiness, sweating, hunger, dizziness, blurred vision, and confusion can occur. In older adults this raises fall and cognitive risks, and in people using glucose‑lowering medications it flags a mismatch between insulin action and intake. Very low HbA1c in treated diabetes may imply recurrent unrecognized lows, and a very low eAG tracks the same pattern.

Big picture, these biomarkers connect glucose handling with lipid metabolism, blood pressure regulation, coagulation, and inflammation. Persistently higher readings accelerate atherosclerosis, kidney and retinal injury, and neuropathy; steadier, lower exposures support vascular resilience, liver health, and long‑term heart, brain, and kidney outcomes.

What Insights Will I Get?

Diabetes biomarkers show how your body manages glucose—the core fuel for cells—and how that control affects blood vessels, nerves, kidneys, liver, brain, immunity, and cardiovascular risk. Poor control accelerates atherosclerosis, fatty liver, and cognitive change. At Superpower, we test Glucose, HbA1c, eAG, and the TyG Index.

Glucose is the current blood sugar level (acute glycemia). HbA1c is the share of hemoglobin coated with sugar (hemoglobin glycation), reflecting average glucose over about three months and chronic hyperglycemia. eAG converts HbA1c into an everyday average glucose estimate. The TyG Index combines fasting triglycerides and glucose to estimate insulin resistance and disordered fuel partitioning; higher values are linked to progression to type 2 diabetes and cardiovascular events.

Together, these markers map stability and healthy function. A stable fasting glucose suggests balanced liver glucose output and effective insulin action. An appropriate HbA1c/eAG indicates low glycemic variability and a lower glycation burden on vessels and nerves. A lower TyG Index points to better insulin sensitivity, healthier lipid–glucose signaling, and less cardiometabolic stress; higher levels imply insulin resistance, atherogenic risk, and beta-cell strain.

Notes: Interpretation can be affected by acute illness, recent meals or fasting status, pregnancy, age, and stress. Anemia, hemoglobin variants, kidney or liver disease, and some medications (e.g., steroids, antiretrovirals, beta-blockers, statins) alter glucose, lipids, or HbA1c. Ethnic differences and assay methods can shift HbA1c–glucose relationships. Very high triglycerides can distort the TyG Index.

Superpower also tests for

See more diseases

Frequently Asked Questions About Diabetes Mellitus Type 2

What is Diabetes Mellitus Type 2 testing?

This is a blood test panel that checks how your body handles sugar now and over time. Superpower measures Glucose (current blood sugar), HbA1c (2–3 month average), eAG (estimated average glucose from HbA1c), and the TyG Index (a triglyceride–glucose calculation that reflects insulin resistance). Together, these markers show your metabolic load, pancreatic demand, and vascular glycation burden.

Why should I get Diabetes Mellitus Type 2 biomarker testing?

It detects dysglycemia early and quantifies cardiometabolic risk before symptoms. Glucose and HbA1c/eAG show your chronic glycemic exposure; the TyG Index flags insulin resistance, a driver of Type 2 diabetes, fatty liver, and cardiovascular disease. Superpower’s Glucose, HbA1c, eAG, and TyG Index give a system-level view of glucose control and insulin signaling burden.

How often should I test?

If you have no diabetes and average risk, test every 1–3 years. If you have risk factors or prediabetes, test at least yearly. If you have diabetes, check HbA1c (and eAG) about every 3 months until stable, then every 6 months; pair fasting Glucose and TyG Index with routine labs to track insulin resistance. Repeat sooner after major health changes, new medications, pregnancy, or acute illness.

What can affect biomarker levels?

Meals, alcohol, acute illness, poor sleep, and strenuous exercise can raise Glucose transiently. Steroids, thiazides, atypical antipsychotics, and beta‑agonists shift glucose and lipids. Anemia, hemoglobin variants, kidney or liver disease, and pregnancy can skew HbA1c and eAG. High triglycerides and non‑fasting states alter the TyG Index. Stress hormones and circadian rhythm also modulate insulin sensitivity.

Are there any preparations needed before Diabetes Mellitus Type 2 biomarker testing?

For the most accurate Glucose and TyG Index, fast 8–12 hours (water is fine) and avoid alcohol the day before. HbA1c and eAG do not require fasting. Try to test when you’re not acutely ill. Take your usual medications unless your clinician has advised otherwise, and note drugs that affect glucose or lipids.

Can lifestyle changes affect my biomarker levels?

Yes. Weight change, diet pattern, physical activity, sleep quality, alcohol intake, and stress all influence insulin sensitivity and hepatic glucose output, which shift Glucose and HbA1c/eAG. These same factors change fasting triglycerides, moving the TyG Index. The combined direction of these markers reflects your real‑world metabolic load.

How do I interpret my results?

Fasting Glucose: normal <100 mg/dL, prediabetes 100–125, diabetes ≥126. HbA1c: normal <5.7%, prediabetes 5.7–6.4%, diabetes ≥6.5%. eAG translates HbA1c into mg/dL for day‑to‑day meaning. A higher TyG Index indicates greater insulin resistance and cardiometabolic risk. Look at patterns over time across all four markers; discordance (e.g., normal Glucose with high HbA1c or TyG) suggests hidden risk or assay interference.

How it works

1

Test your whole body

Get a comprehensive blood draw at one of our 3,000+ partner labs or from the comfort of your own home.

2

An Actionable Plan

Easy to understand results & a clear action plan with tailored recommendations on diet, lifestyle changes, supplements and pharmaceuticals.

3

A Connected Ecosystem

You can book additional diagnostics, buy curated supplements for 20% off & pharmaceuticals within your Superpower dashboard.

Superpower tests more than 
100+ biomarkers & common symptoms

Developed by world-class medical professionals

Supported by the world’s top longevity clinicians and MDs.

Dr Anant Vinjamoori

Superpower Chief Longevity Officer, Harvard MD & MBA

A smiling woman wearing a white coat and stethoscope poses for a portrait.

Dr Leigh Erin Connealy

Clinician & Founder of The Centre for New Medicine

Man in a black medical scrub top smiling at the camera.

Dr Abe Malkin

Founder & Medical Director of Concierge MD

Dr Robert Lufkin

UCLA Medical Professor, NYT Bestselling Author

membership

$17

/month
Billed annually at $199
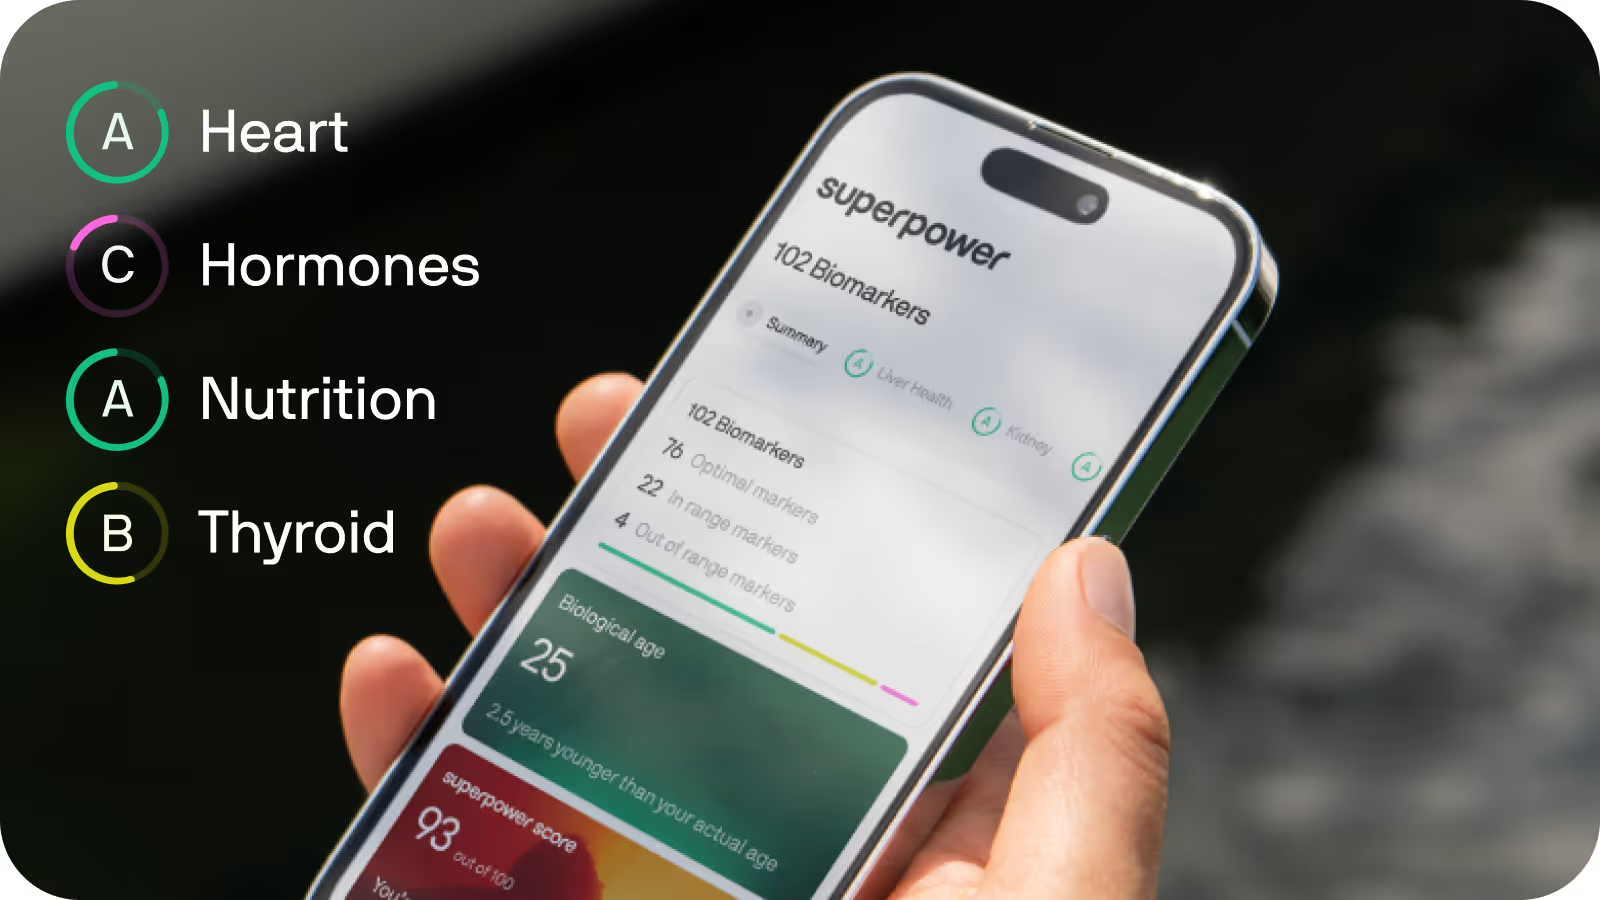
A smartphone displays health app results, showing biomarker summary, superpower score, and biological age details.
A website displays a list of most ordered products including a ring, vitamin spray, and oil.
A smartphone displays health app results, showing biomarker summary, superpower score, and biological age details.A tablet screen shows a shopping website with three most ordered products: a ring, supplement, and skincare oil.
What could cost you $15,000 is $199

Superpower
Membership

Your membership includes one comprehensive blood draw each year, covering 100+ biomarkers in a single collection
One appointment, one draw for your annual panel.
100+ labs tested per year
A personalized plan that evolves with you
Get your biological age and track your health over a lifetime
$
17
/month
billed annually
Flexible payment options
Four credit card logos: HSA/FSA Eligible, American Express, Visa, and Mastercard.
Start testing
Cancel anytime
HSA/FSA eligible
Results in a week
Pricing may vary for members in New York and New Jersey **

Finally, healthcare that looks at the whole you